Answer: Option D


Answer: Option D
Video 01: The various physical quantities in kinematics
Video 02: Acceleration
Video 03: Graphical Analysis of Motion (Displacement (distance)-Time Graph and Velocity (speed)-Time Graph)
Video 04: Describing the motion of the car – practice
Video 05: Free-fall, acceleration due to gravity
Video 06: Motion of 2 objects
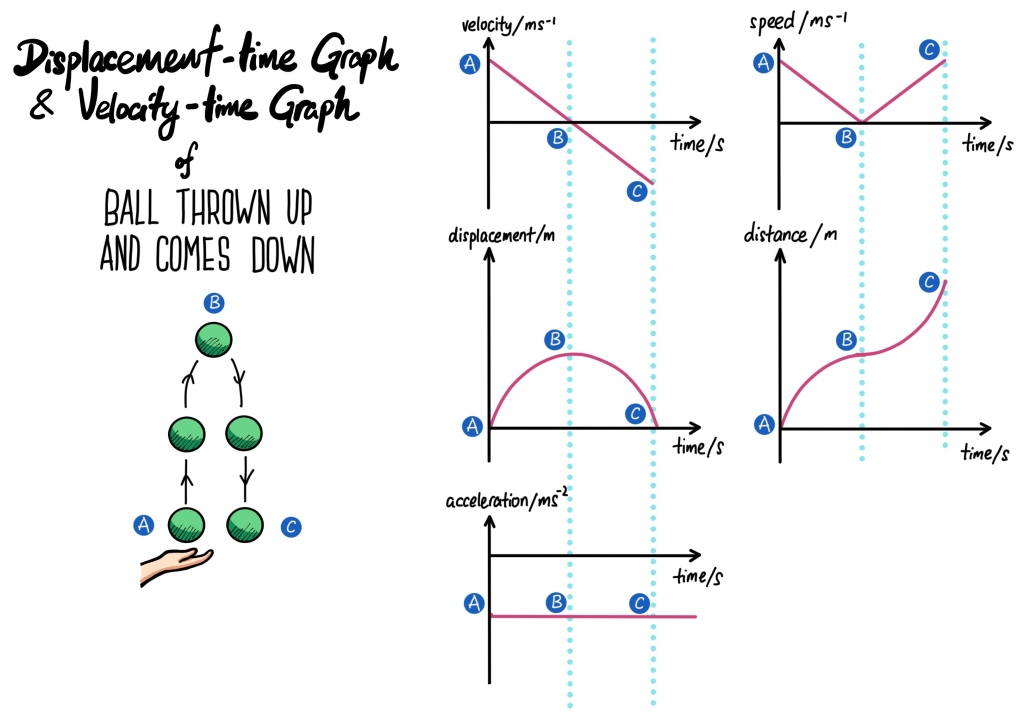
1) When a ball is thrown up and it comes down
When the ball leaves the hand, there is no upward force acting on the ball. The only force acting on the ball is its weight. This net force is opposite to the motion of the ball, hence causing the ball to decelerates. Refer to this post for the explanation (comics)


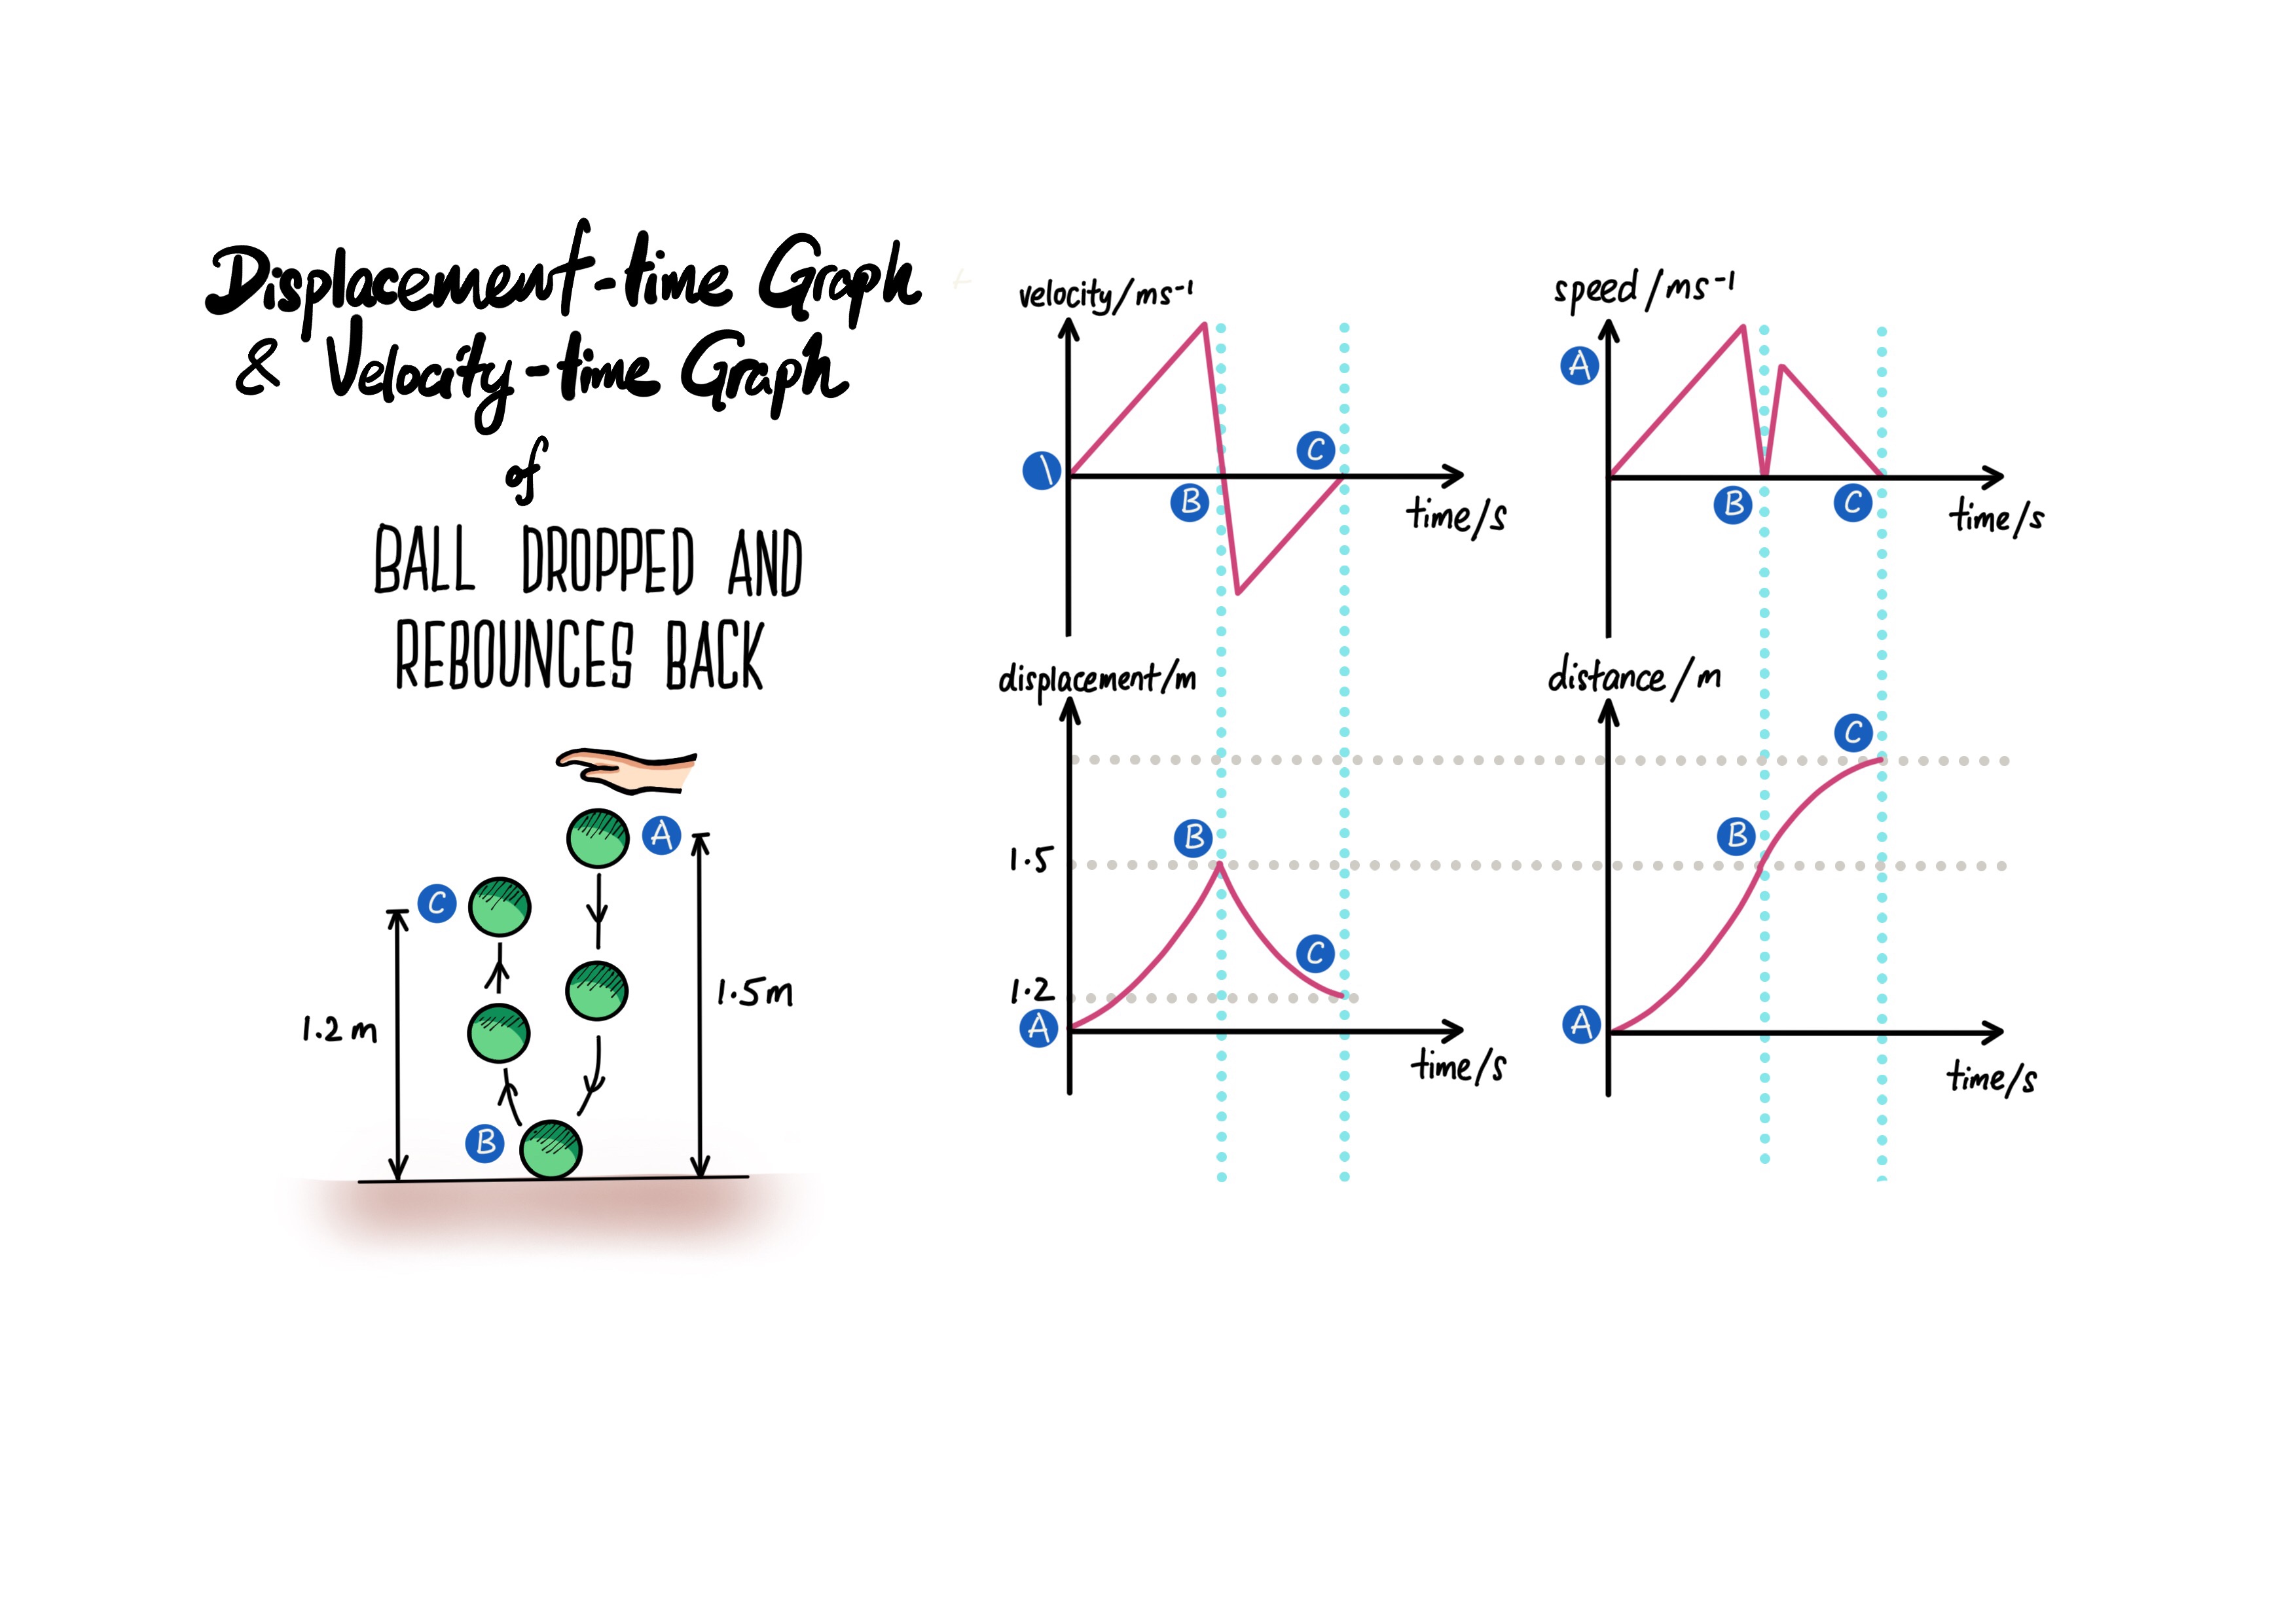
3) When the ball is dropped and it re-bounces back (in reality with energy lost)
In reality, when the ball hits the ground, there will be some energy converted to heat and sound. So the ball will never return to its original height that it was released. So how will the graphs look like?

When a ball is thrown up vertically from a height and the falls to the ground, the various kinematic graphs below shows the same motion of the ball.
Fixing up as positive, if the ball is going up, it’s displacement and velocity will be in the positive region. When it falls, the direction is opposite, hence it’s in the negative portion.
Recall that the gradient of a velocity-time graph represents the acceleration. Using this concept, it will be easier to understand that the acceleration is a negative constant acceleration, thus – 10 ms-2.
(Thanks Maria for suggesting this post and the addition of acceleration-time graph)
 Click here to refer to the post related to this motion.
Velocity-time and Displacement-time Graph for a ball being thrown up
Velocity-time and Displacement-time graph for Ball thrown up and comes down
In this this question, the displacement-time graphs are given, which are different from displacement-distance graphs.


In the displacement-time graphs of A and B, they show the displacement of that particular point at different timing. E,g, at t = 0s, the A is at the rest position (0 displacement) and at time 0.2 s it is at the maximum displacement. This means A is going up from t = 0 s to 0.2 s.
Solutions:
(a) Amplitude: 1.5 cm
(b)(i) Frequency is the number of complete waves produced in 1 second.
(ii) period T = 0.8s, f = 1/T = 1/0.8 = 1.25 Hz
(c) Closest possible positions of A and B, (refer to the video), is when the
time taken for the wave to move from A to B is T/4 = 0.8/4 = 0.2 s.
speed = distance/time = 38/0.2 = 190 cm/s approx. 200 cm/s
(ii) There are various possibilities in which B can be 38 cm to the right of A. Besides T/4, it can be 1.25T or 2.25 T etc. Hence the speed can be other values.
Refer to the video explanation below

When a ball is released from a height, it will accelerate on the way down due to the resultant force (weight) acting downwards. Just before the ball touches the ground, the velocity of the ball is the maximum. When it hits the ground, the speed decreases to 0 m/s instantly. When it rebounces back in the opposite direction, the initial velocity is the maximum. Assume ideal situation (no air resistance, no energy lost to sound or heat). The ball will rebounce back to its original height.
In reality, there is work done against air resistance, energy converted to heat and sound when ball hits the ground, hence the ball will never reach its original height.
Note that in both situations, conservation of energy always applied. All energy is conserved, just that energy of the ball is converted to other forms like heat and sound.
Click here to view a comic on forces explanations of ball thrown up
Click here to view the post on velocity-time and displacement-time of ball thrown up
A ball is thrown vertically upwards from the hand and lands back onto the hand. It is important to note that once the ball leaves the hand, the resultant force acting on the ball is only its weight! And it is acting downwards throughout the motion.
Velocity-Time Graph
Displacement-Time Graph
Key points to note when sketching the v-t graph:
1) Fixing the direction up to be positive (can be down as positive if you want)
2) At t = 0s, the initial velocity of the ball is maximum.
3) As it goes up vertically, due to the weight acting downwards, the ball decreases in speed (decelerates)
4) At the highest point, the ball is momentarily at rest (v =0m/s)
5) On the way down, due to the weight of the ball acting downward, the ball accelerates downwards.