
China’s 1st large-scale sodium battery energy storage station put into operation


In general, assuming temperature of a conductor is constant, the resistance of a conductor is affected by
1) length (L) – [L increases, R increases]
2) cross-sectional area (A) – [A increases, R decreases]
3) resistivity (p) = [p increases, R increases]
As R is directly proportional to L and p, and is inversely proportional to A,
R = pL/A
There are times when using the formula is more appropriate.
Centre of gravity (CG) of an object is an imaginary point where the entire weight if the object seems to act.
In Singapore, we use the 3-pin wall socket 240 V. In general, it is more convenient if the plug of appliance is 3-pin. But certain appliances we bought online may not be, just like the fan shown in the video below. It has 2 pins, i.e. a live wire and a neutral wire. No earth wire is present as the outer casing is made of electrical insulator, plastic.
Take a look at the video, and you can easily convert the 2=pin to 3-pin plug.
Below are the questions.

2003PPq1q7 (0 min to 2.42 min) Ans: Option A

2023PPp1q4 (2.47 min 3.54 min) Ans: Option C

2018PPp1q2 (3.45 min to 6.22 min) Ans: Option D

2011PPp1q6, 2016PPp1q6 (6.22 min) Ans: Option A
Below are some examples of questions that involve finding the resultant force due to two or three forces.
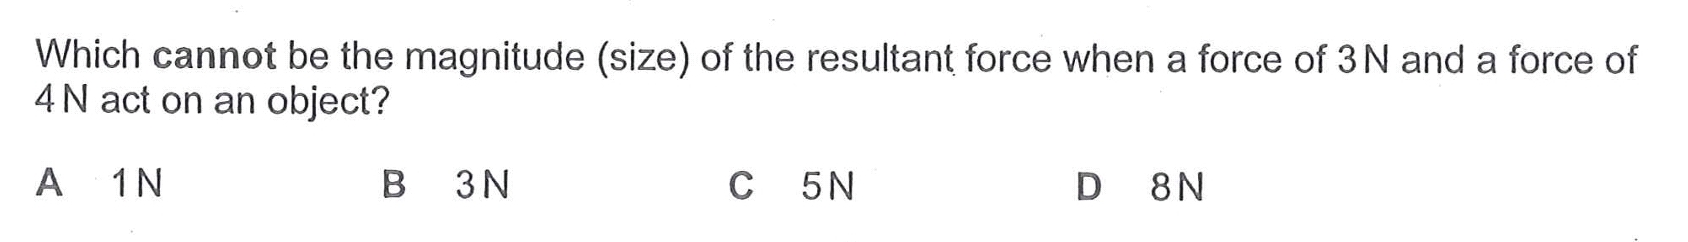
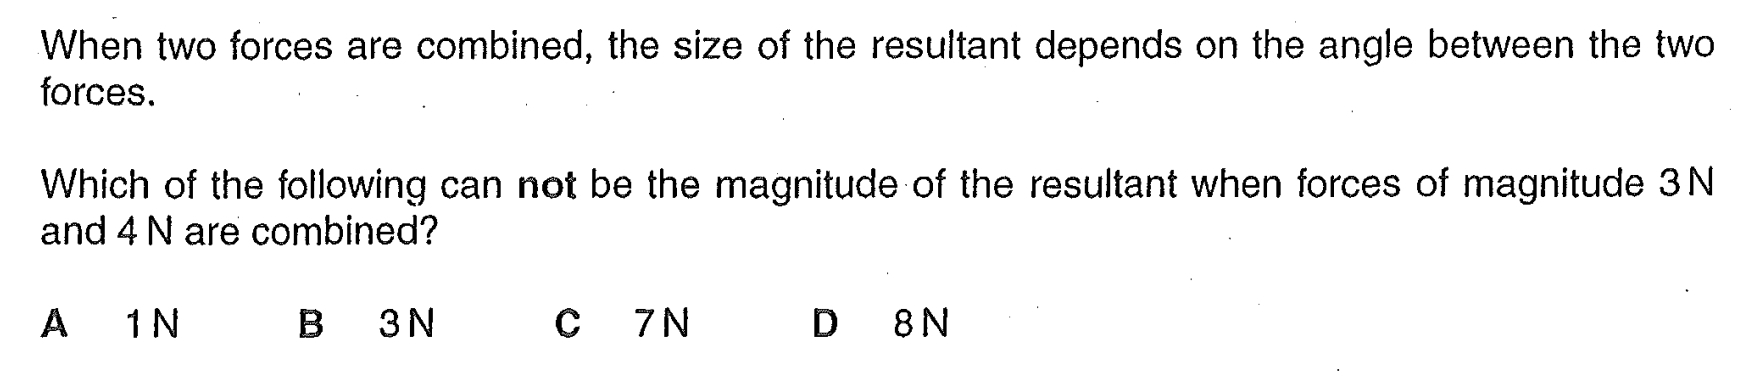
2010PPp1q2 similar to 2002PPp1q7 (0s to 3.02 min) Ans: Option D and D respectively
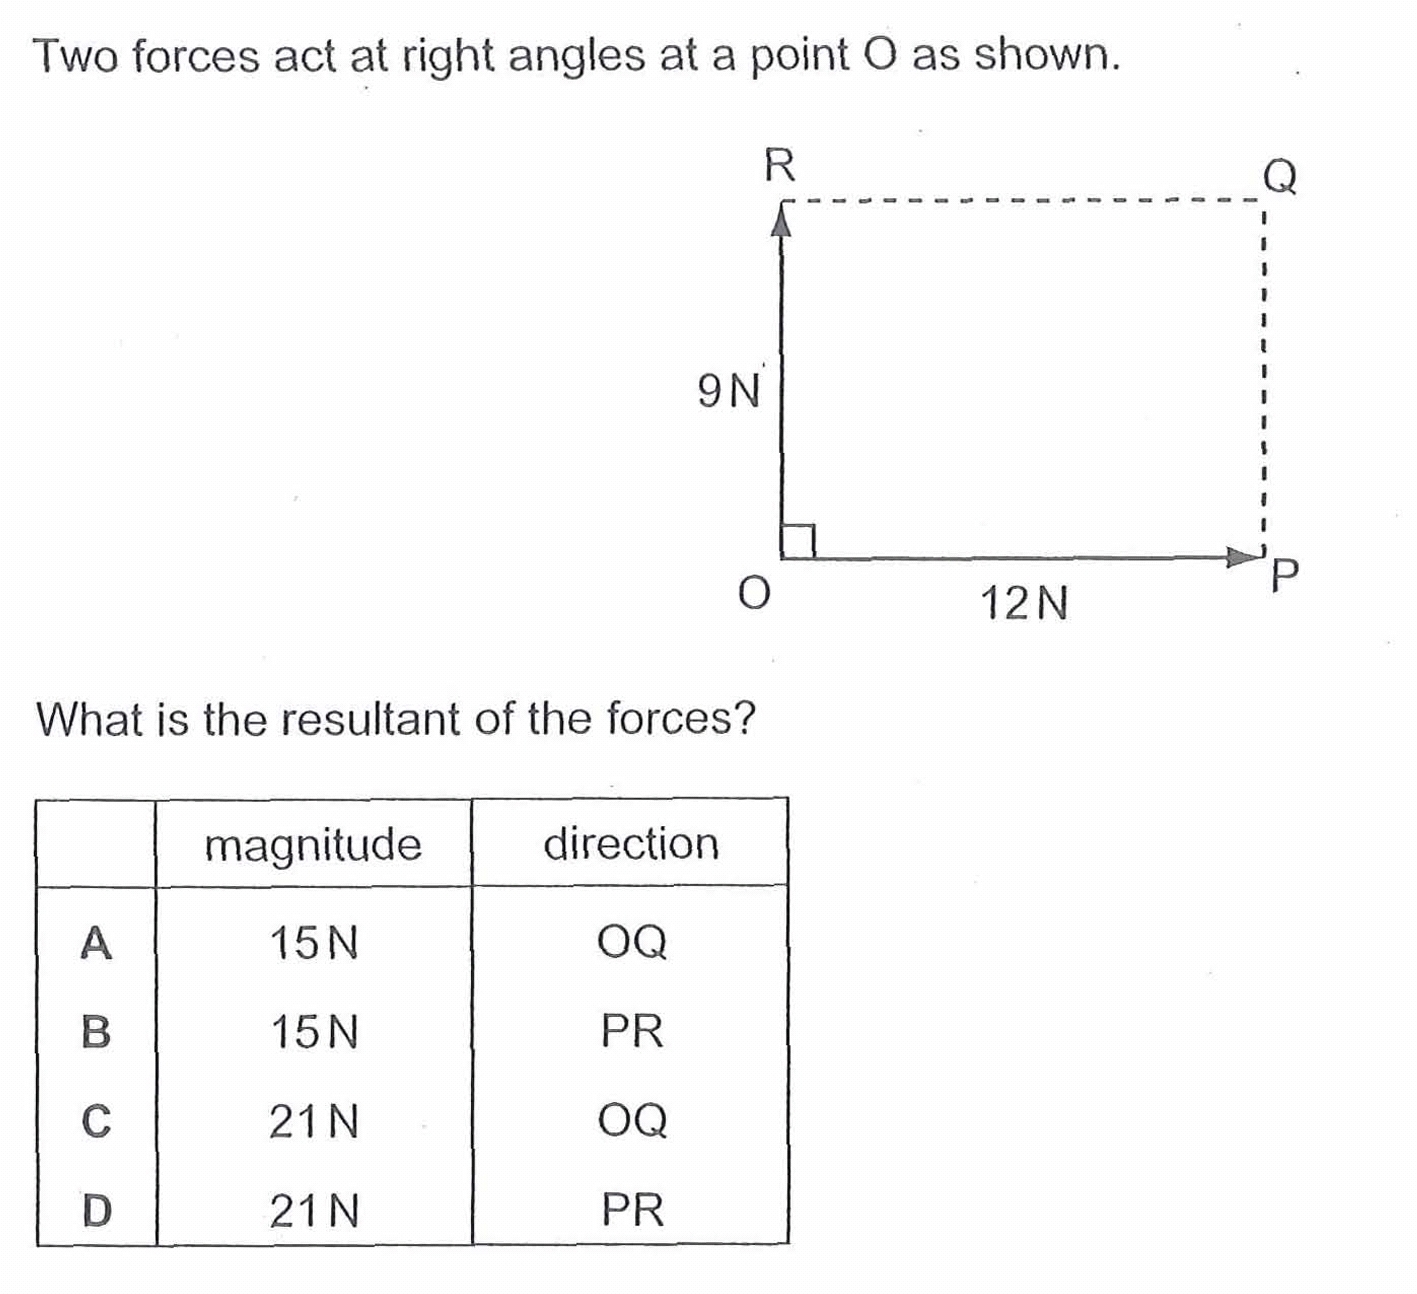
2005PPp1q10, 2012SPp1q1, 2018PPp1q2 (4.25 min to 6.40 min) ANs: Option A
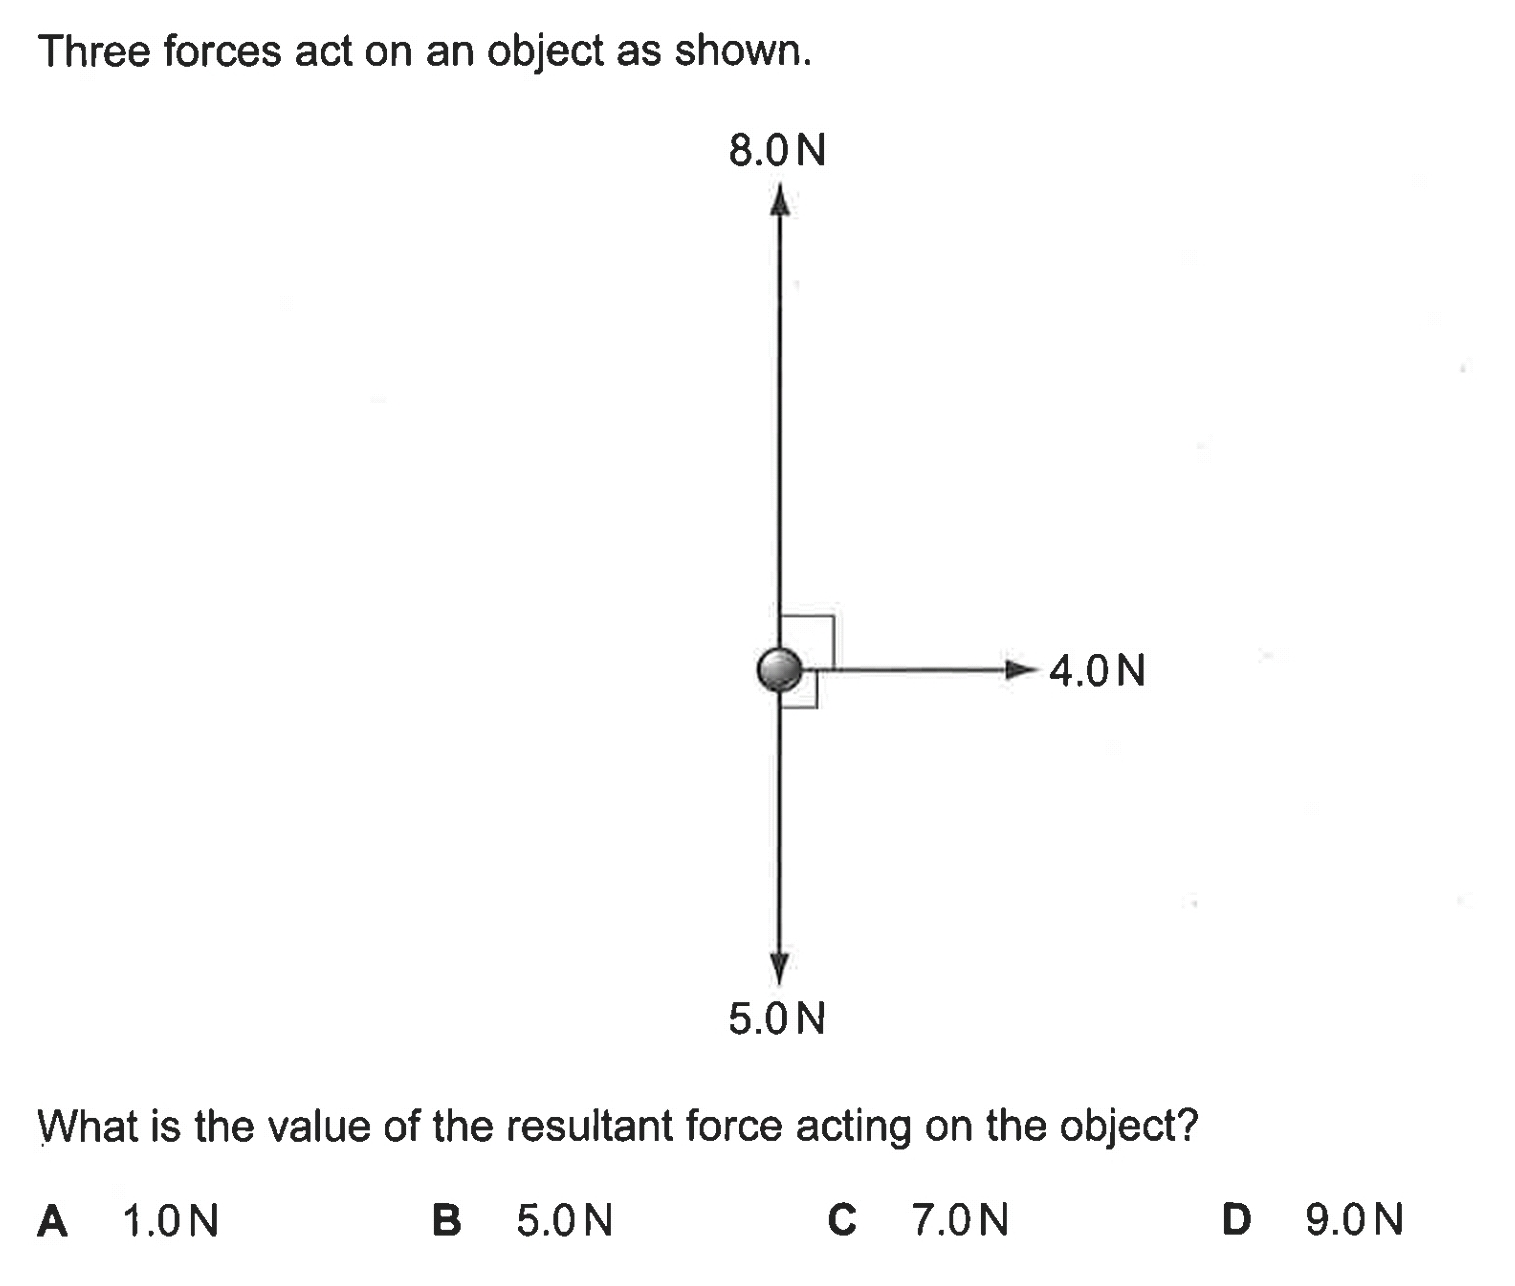
2014PPp1q8 (6.40 min to 7.48 min) Ans: Option B
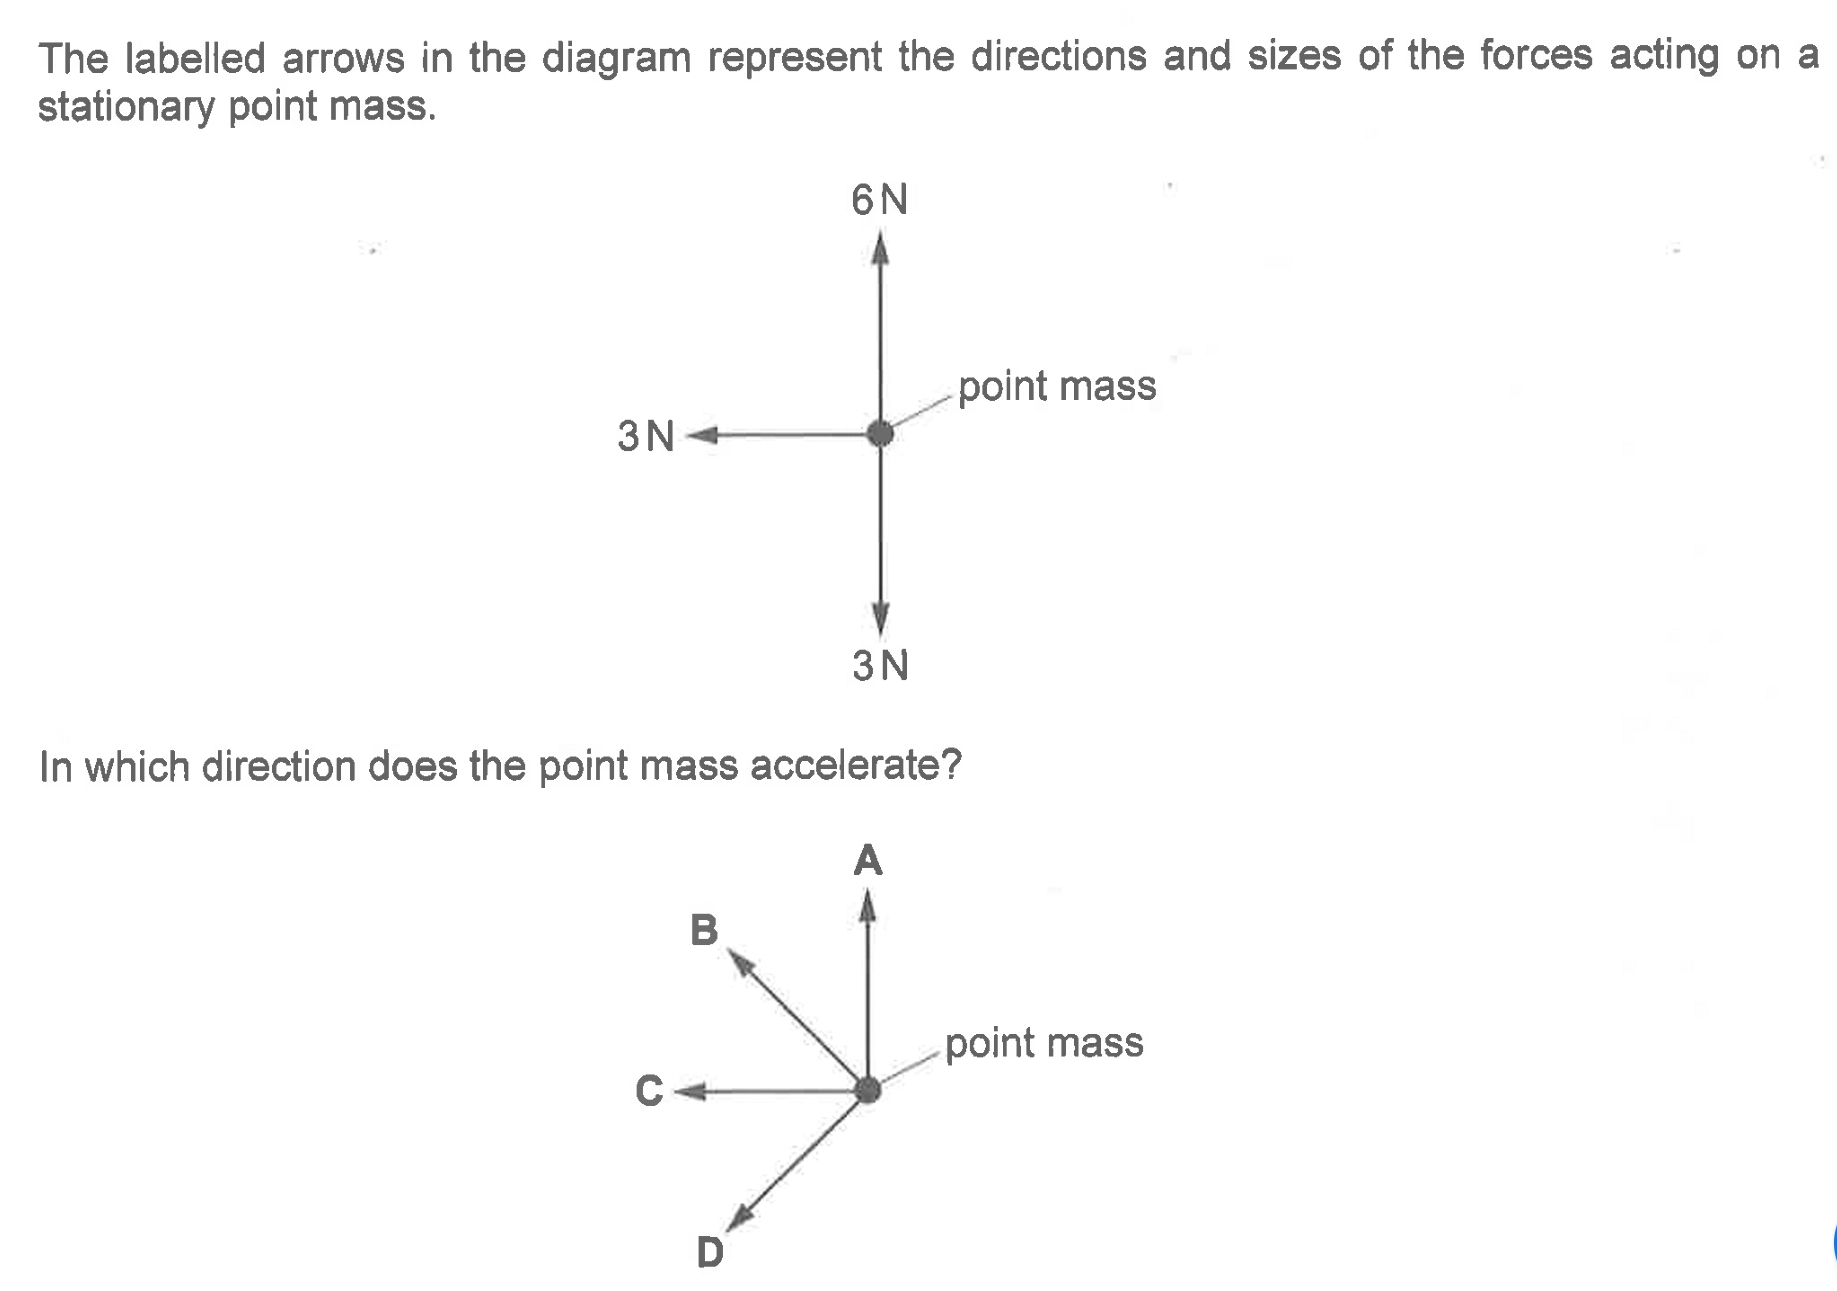
2019PPp1q2 (7.48 min to 8.22 min) Ans: Option B
2020PPq1q3 (8.22 min to end) Ans: Option B
When two components are connected in series, where one is a fixed resistor and the resistance of the other can vary (e.g. thermistor, light dependent diode, variable resistor etc), you always make use of the fixed resistor to explain the its p.d. as resistance is constant.
Then use the concept of sum of p.d. across both components is equal to the e.m.f of the circuit to explain how the p.d. across the other component varies.
Though thermistor is not in SciPhy syllabus, it can still be tested as long as the information on thermistor is given. Refer to the videos below where 2 are from Sciphy and the other is from Pure.
Instead of P = IV to explain, it might be easier to explain using P = I^2R when the components are connected in series where current I is constant. Hence power P is directly proportional to R. The bigger the R, the more power it uses.
Likewise, if the components are connected in parallel, it will be easier to use P = V^2/R, as the potential difference is constant for the components connected in parallel. Hence, power P is inversely proportional to R. The smaller the R, the more power it uses.
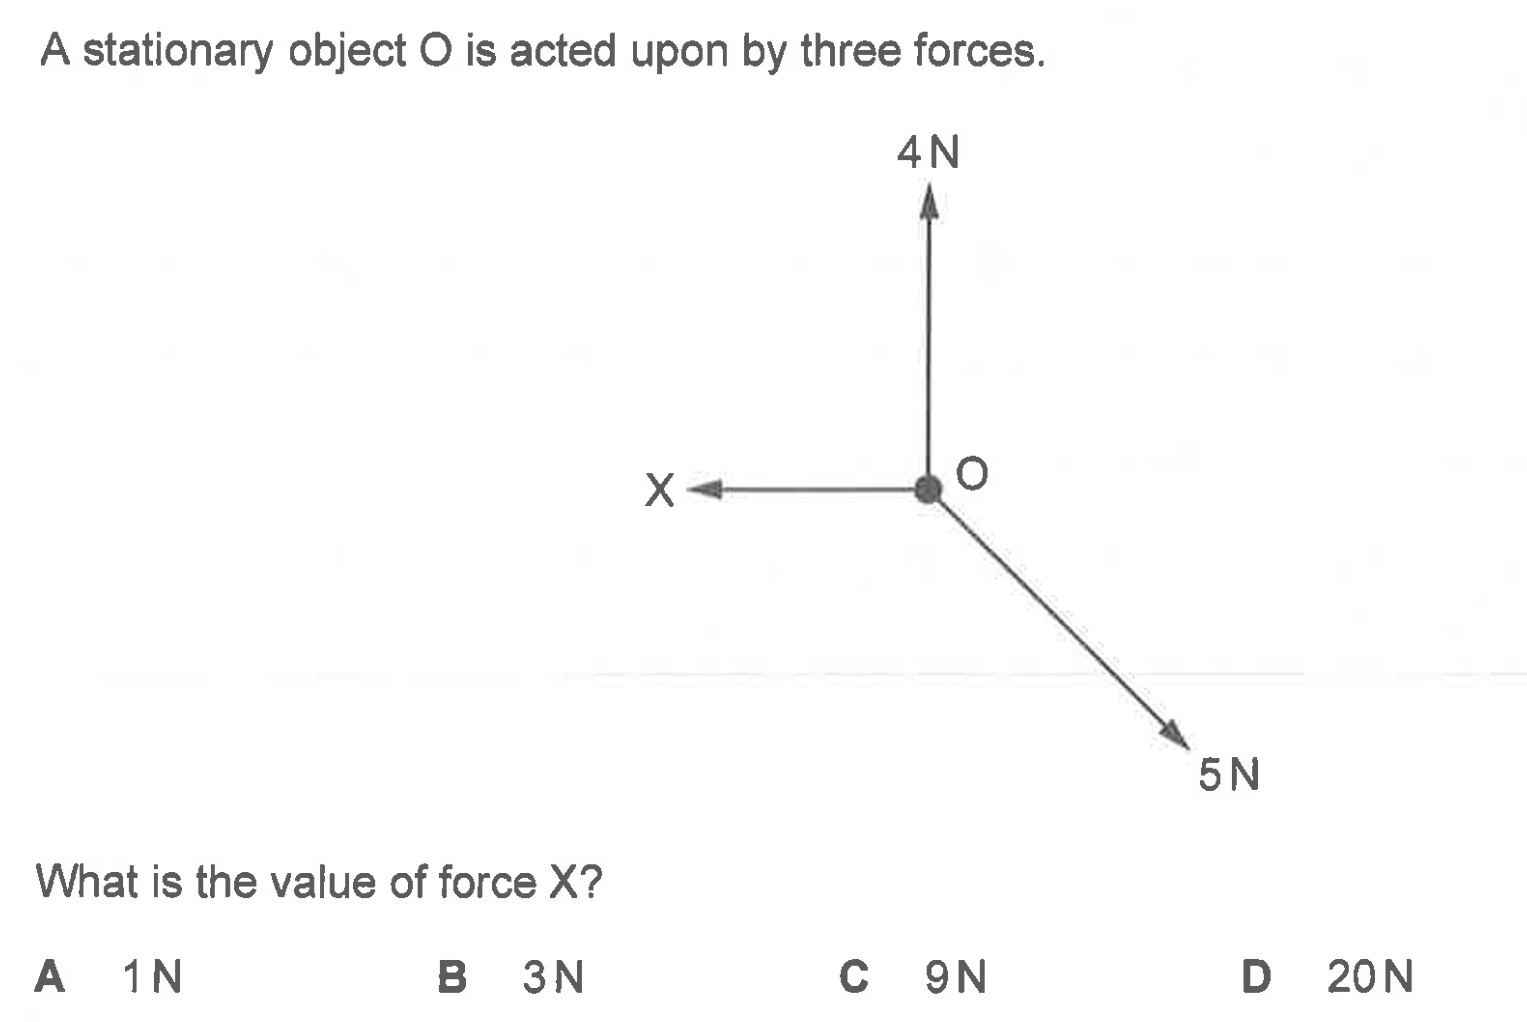
SP2021Q8
PP2017Q11


Answer: Option D
There are two main types of balancing toys.
Type 01: CG below the pivot point

Type 02: CG above the pivot


The digital stopwatch has a precision of 0.01s.
Depending on the experiment, the recording of measured time may be to the nearest 0.1 s or the nearest 1 s, even though a typical digital stopwatch has a resolution of 0.01 s. This is to account for uncertainty due to human reaction time or due to the time taken for observing whether an event has indeed occurred. More importantly, do follow the instructions given in paper. That will take precedence.
In general, the following should be considered when using a stopwatch to record time:
1) Human reaction time
Uncertainty due to the reaction time required between deciding that an event has
occurred and stopping the stopwatch, e.g., time taken for a pendulum bob to make 20
oscillations should be recorded to 1 d.p. in seconds.
2) Nature of experiment
Uncertainty due to the time taken for observing whether an event has indeed occurred
e.g., time at which water starts to boil or a chemical reaction takes place should be
recorded to the nearest second.

The deeper the Titan goes under the water, the greater the pressure on the wall vessel of the Titan.
Liquid pressure P = ρgh
Liquid pressure = density of water x gravitational field strength x height of water before water surface
Inside the vessel, the pressure is maintained at about atmospheric pressure for the crews to breathe normally, just like on sea level or on ground.
Due to the huge pressure difference between outside and side, the Titan will implode when the hull of the vessel is not able to withstand the pressure.
Deepest condolences to the crews…
https://www.straitstimes.com/world/titan-submersible-what-is-a-catastrophic-implosion
In the lab, usually we use these two types of voltmeter. One with a range of 0 to 3 V and the other with a range of 0 to 5 V.
Watch the video to learn how to read the respective voltmeter and how to record the reading.
Electronic balance (and beam balance) is used to measure mass. Below is a typical electronic balance we use in the lab. Look through the video to learn how to use and record the readings.
In the lab, we usually use two types of ammeter of range 0 to 1 V and 0 to 3 V.
View the video below to learn how to read and how many decimal places to record for the current.

Subscribe to get access to the rest of this post and other subscriber-only content.
Refer to this link on the analogue micrometer screw gauge
https://youtu.be/jqvYjaOUa20
Reading micrometer screw gauge practice
https://youtu.be/S1Mvb5kHnJg
Once the best fit line is drawn, it is very common to find the gradient. Finding the gradient and showing on the graph how you get the gradient will usually be awarded 2 marks.
Besides the gradient working of (y2 – y1) / (x2 – x1) in the space provided with correct s.f and units is usually 1 mark
Choosing 2 new points on the line (far apart) to find gradient, with dotted triangle and coordinates of the 2 new points is usually 1 mark.
View the video below to find out more. There are 4 examples in the video to show you the different gradients and how to find the y-intercept.
In general, the plotting of graph for Physics practical is usually 4 marks.
The break down of the 4 marks are as below:
Go through the video to have a better idea on how to plot the graph and get the marks.
To do similar questions, it is important to know the 3 rays which have rules to follow in order to locate the image. Look through the video to learn the concepts and hopefully you can do similar questions in future.


With new advances in mobile devices, the battery capacity of the lithium-ion battery increases with each new model.
For instance, the flagships phone like iPhone 14 max Pro has an capacity of 4323 mAh, Samsung S22 Ultra 4855 mAh and the Z fold 4 4400 mAh. We tend to think that the constant charging of our phones will use a lot electrical energy, hence increases our electrical bill.
But is it true?

Pure Physics 2019 P1Q33 and 2007P1Q28


Torch lamp or bulb is a non-ohmic conductor. The V-I graph has an increasing gradient indicating resistance increases. As the current through the filament of bulb increases, temperature increases and resistance increases.
For an ohmic conductor, the graph of V against I is a straight line with constant gradient and passes through the origin.
Something to thing about:
What if there is an option E where
V increases from 0, 1, 2, 3
I increases from 0, 6, 10, 12 respectively
The graph will be a typical ohmic graph, similar shape to option B, but will you choose E?
Refer to the last section of the video from 4:37 s.
There have been a few questions in Olevel asking students the direction of the friction on the wheel, It is important to consider if the wheel is connected to the engine or not.
Below is an illustration on this concept.

You can view the explanation plus the 4 examples from Olevel p1 in the video below.
Examples


Refer to the video above for the answers

Ans: Option A
View the video tutorial for the explanation:

View the video tutorial for the explanation
Most of us know that when the treads of our typical car tyres are worn out, we need to change as to provide grip, hence our car will not skid easily.
But actually, the treads of our typical car serve a more important role during rainy days. They allow the water to be displaced (quickly letting the water to move into the treads) so that the tyres can still maintain contact with the road to provide the grip. Of course, if you still go too fast on a wet road, that layer of water may not be able to be displaced in time, hence grip on the road is greatly reduced and the car is likely to skid.
Especially in the recent F1 race in Singapore, due to the wet weather, the cars had to changed to hard wet tyres. Many may be puzzled why F1 cars uses smooth slick tyres during dry weather, contrary to our common sense for our typical cars. The graphic below hopes to provide some basic explanation to the wet and dry tyre and the function of the tread on tyre. Hope it helps.

The following video gives a good overview of how a tyre works. There is a lot of science behind them.
Once you know the basic concepts, try applying the POM in other application questions. Refer to the two videos below.


